
The portfolio network is made up of lines, or arcs representing the direction of flow and nodes or circles representing portfolio transaction points. There are three kinds of network arcs. Input arcs feed money into the portfolio, output arcs take money out of the portfolio, and investment arcs allow the flow of money within the portfolio through various investments, or liabilities. Each network arc has one arrow showing the direction of monetary […]
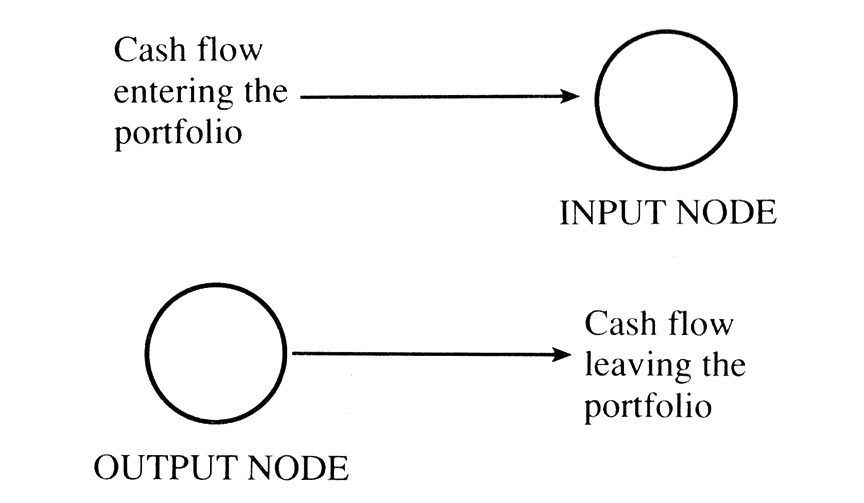
Input and Output Nodes to the Portfolio Network
flow on the arc. Portfolio nodes represent transaction points. Transaction nodes are locations or stages at which money flows into other investments, or is divided into cash flows designated for different purposes. An input or supply node is a point where money is fed into the portfolio and output node or demand node is a point where money leaves the portfolio. Investment arcs connect two nodes. The above figure shows basic input and output nodes.
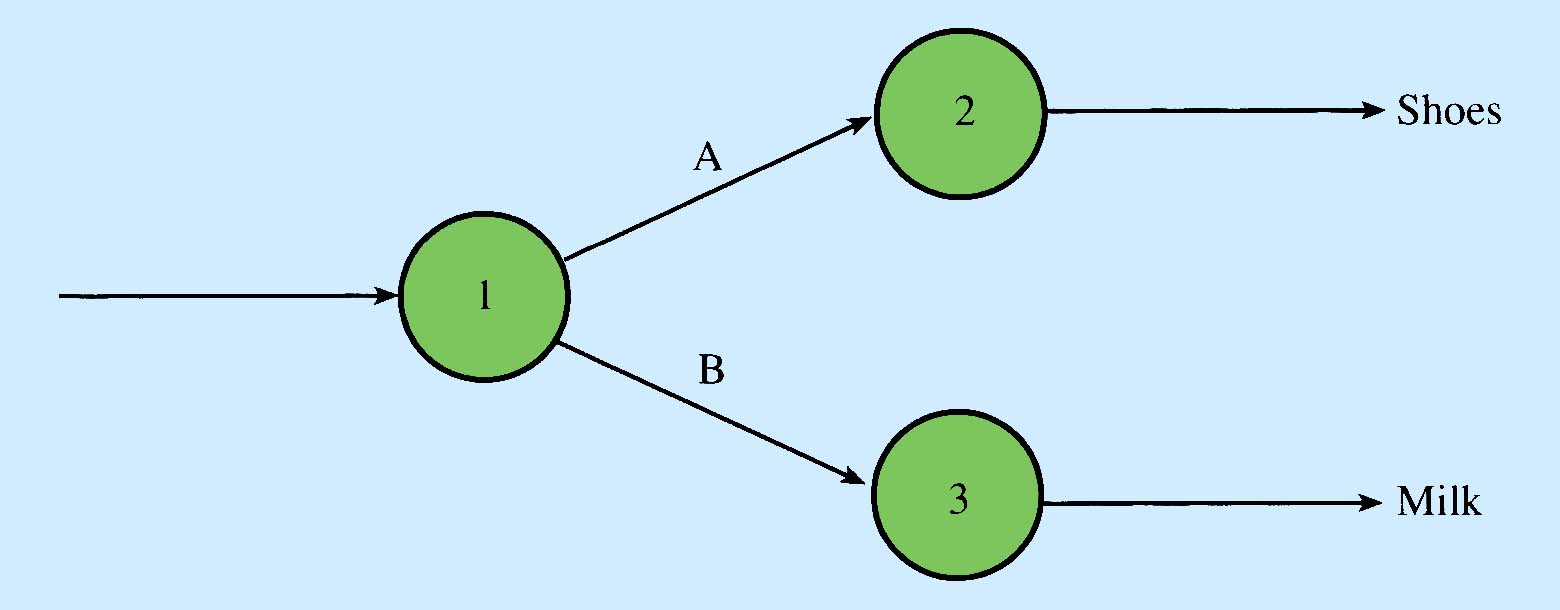
Simplest Pure Portfolio Network
The above figure shows a simple example of a pure portfolio network. The portfolio network has one input node, two output nodes and two investment arcs. The flow of money to the portfolio is divided between investment arcs A and B. The money is input to the portfolio at node one. There are two flows of money out of node one. Arcs A and B are investment arcs that connect two nodes. Nodes two and three are output nodes that represent demand for money for two different purposes.

Pure Portfolio Network with Investment Arcs
There are limits, or restrictions on the money flowing on input, output and investment arcs. These limits are called bounds and are attached to each arc. There is an lower bound and a upper bound written in parentheses on each arc. The solution to the portfolio network must satisfy the bounds on all the arcs. The solution will be the amount flowing on each of the arcs. There is a flow conservation condition which requires the sum of the money flowing into each node equals the sum of money flowing out of that node. There are two requirements for a feasible solution to any portfolio network; the flow conservation condition at each node, and the boundary conditions on each arc. The flow on each arc must satisfy the lower and upper bounds on that arc. In this simple example portfolio network in the above figure there are several feasible solutions. The optimal solution will depend on the portfolio objective. To formulate the objective function a profit or cost must be added to each investment arc.

Investment Profits and Commission Costs
THE PORTFOLIO OBJECTIVE
Every portfolio network has an objective, which is generally to maximize the investor’s return, cash flow, or utility. By stating the objective the portfolio network becomes an optimization problem. Generally all portfolio networks optimization problems can be transformed to profit or return maximization problems, or to cost minimization problems. This is accomplished by adding to each investment arc a profit or cost box. In the portfolio network figure above each investment arc has a box that represents a profit or cost associated with the flow on that arc. The number in the box gives the profit per unit of money flowing through the investment arc. In this portfolio, cash is being added to an existing portfolio of IBM stock and a savings account. There are commission costs to buy or sell IBM represented by negative profit boxes. Here we are assuming that the profits and costs are all percentages of the monetary flow. The profit associated with each arc is the value in the box times the money flowing in the arc. The objective function of this portfolio network will be to maximize the total profit flowing out of node 5.